
istio - 도구
4가지의 GUI 도구
- istio
- kiali
- jaeger
- grafana
kiali
Response Time은 Workload graph에서만 볼 수 있다.
workload graph와 service graph의 detail은 다른다.
workload graph
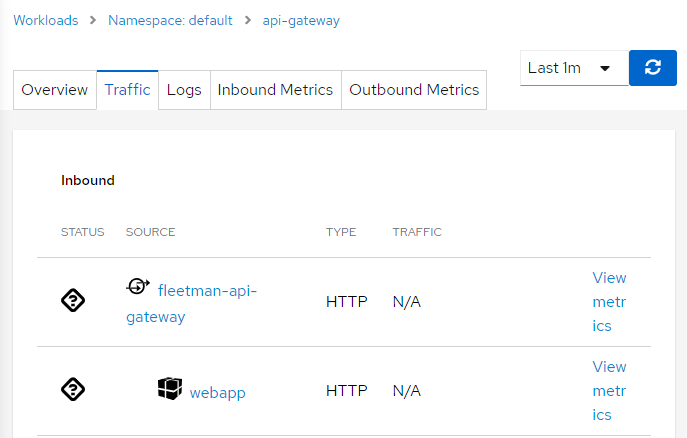
- Overview
- pod logging
- inbound/outbound
Service graph
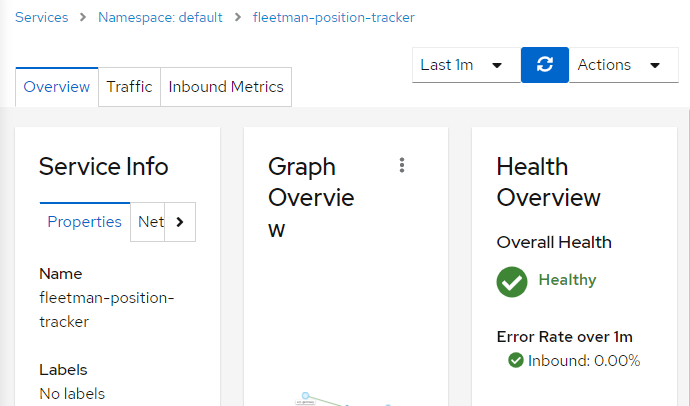
- Overview
- pod metric
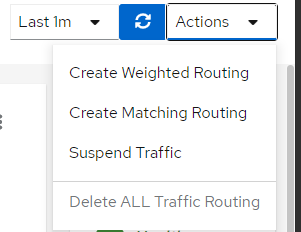
graph에서 바로 트래픽을 컨트롤 할 수 있다.
k get vs(virtualservices)
k get dr(destinationroles)
Tracing Tool
- zipkin
- jaeger
- Yeager
Jaeger
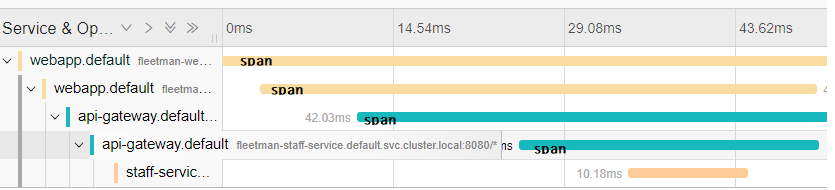
Header를 확장시켜야 하는 이유
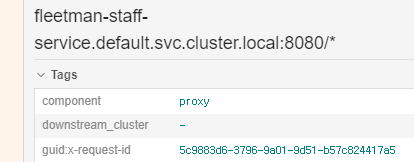
모든 span이 동일한 x-request-id를 사용하는 것을 확인 할 수 있다.
즉 동일한 아이디로 그룹화 된다.
x-request-id: 고유한 아이디로 추적에 사용, istio가 자동으로 생성
애플리케이션은 request로부터 다음 헤더를 수집해 전달해야한다.
x-request-idx-b3-traceidx-b3-spanidx-b3-parentspanidx-b3-sampledx-b3-flagsx-ot-span-context
def getForwardHeaders(request):
    headers = {}

    # x-b3-*** headers can be populated using the opentracing span
    span = get_current_span()
    carrier = {}
    tracer.inject(
        span_context=span.context,
        format=Format.HTTP_HEADERS,
        carrier=carrier)

    headers.update(carrier)

    # ...

    incoming_headers = ['x-request-id', 'x-datadog-trace-id', 'x-datadog-parent-id', 'x-datadog-sampled']

    # ...

    for ihdr in incoming_headers:
        val = request.headers.get(ihdr)
        if val is not None:
            headers[ihdr] = val

    return headers
-> webapp -(xrequest-id=47)> Proxy -> proxy -> API Gateway -(xrequest-id=47)> Proxy
모든 애플리케이션에서 구현하여야 한다.
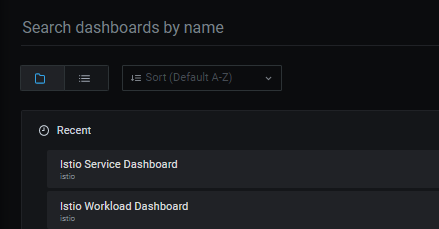
Grafana
- istio workload
- istio servicedashboard
댓글남기기